

ValheimPerformanceAnalyzer
Profiles Valheim/mod callbacks, frame percentiles and slow frames, profiler overhead, loaded objects, process/GPU metrics, and network/RPC diagnostics. Includes a HUD, HTML reports, and optional admin-only server telemetry.Valheim Performance Analyzer
A BepInEx tool for finding which Valheim and mod callbacks consume the most time during gameplay. Includes frame percentiles, a slow-frame timeline, measured Analyzer work, optional simulation detail, compatibility coverage, and network/RPC diagnostics. Version 1.1.3 adds responsive HUD tables and a capture status countdown synchronized to real elapsed capture time.
Features
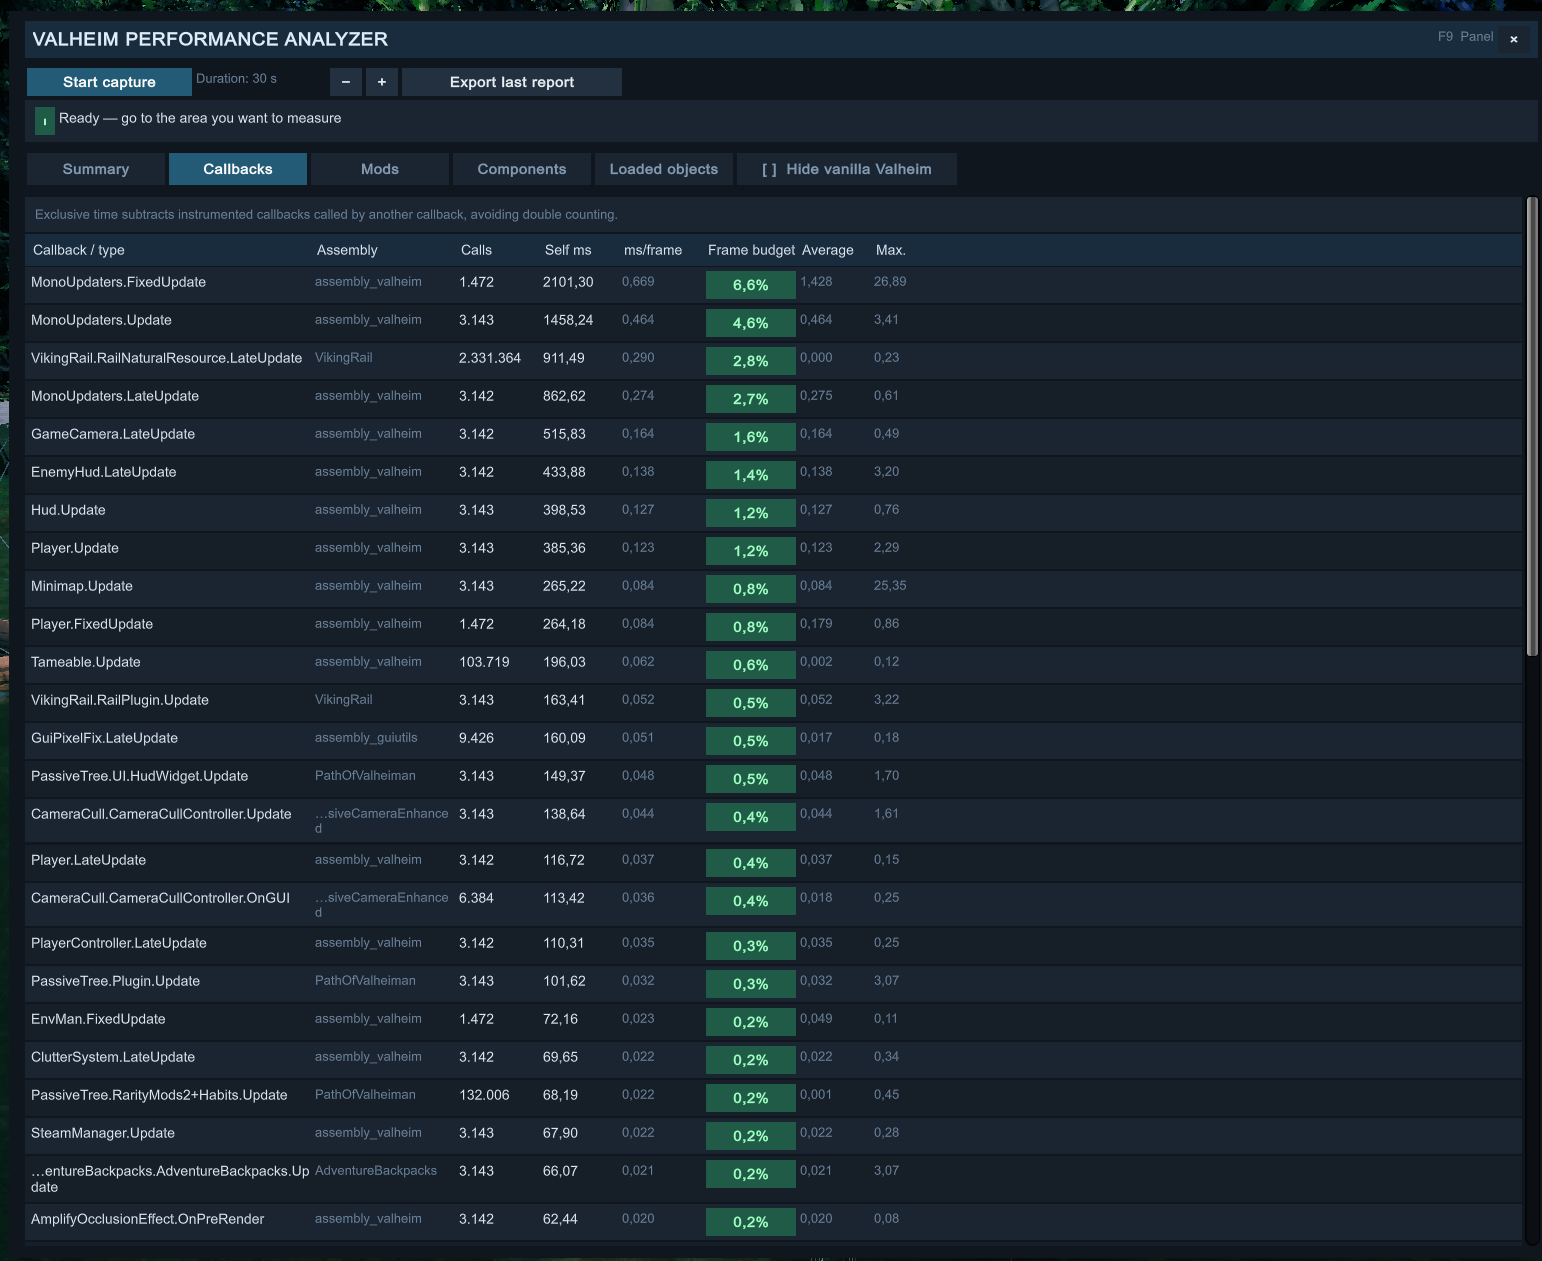
- Measures exclusive time, call count, average and maximum duration, and exceptions for instrumented recurring callbacks.
- Starts the measurement clock after capture preparation and patch installation. Preparation and patching times are reported separately from the recorded gameplay window.
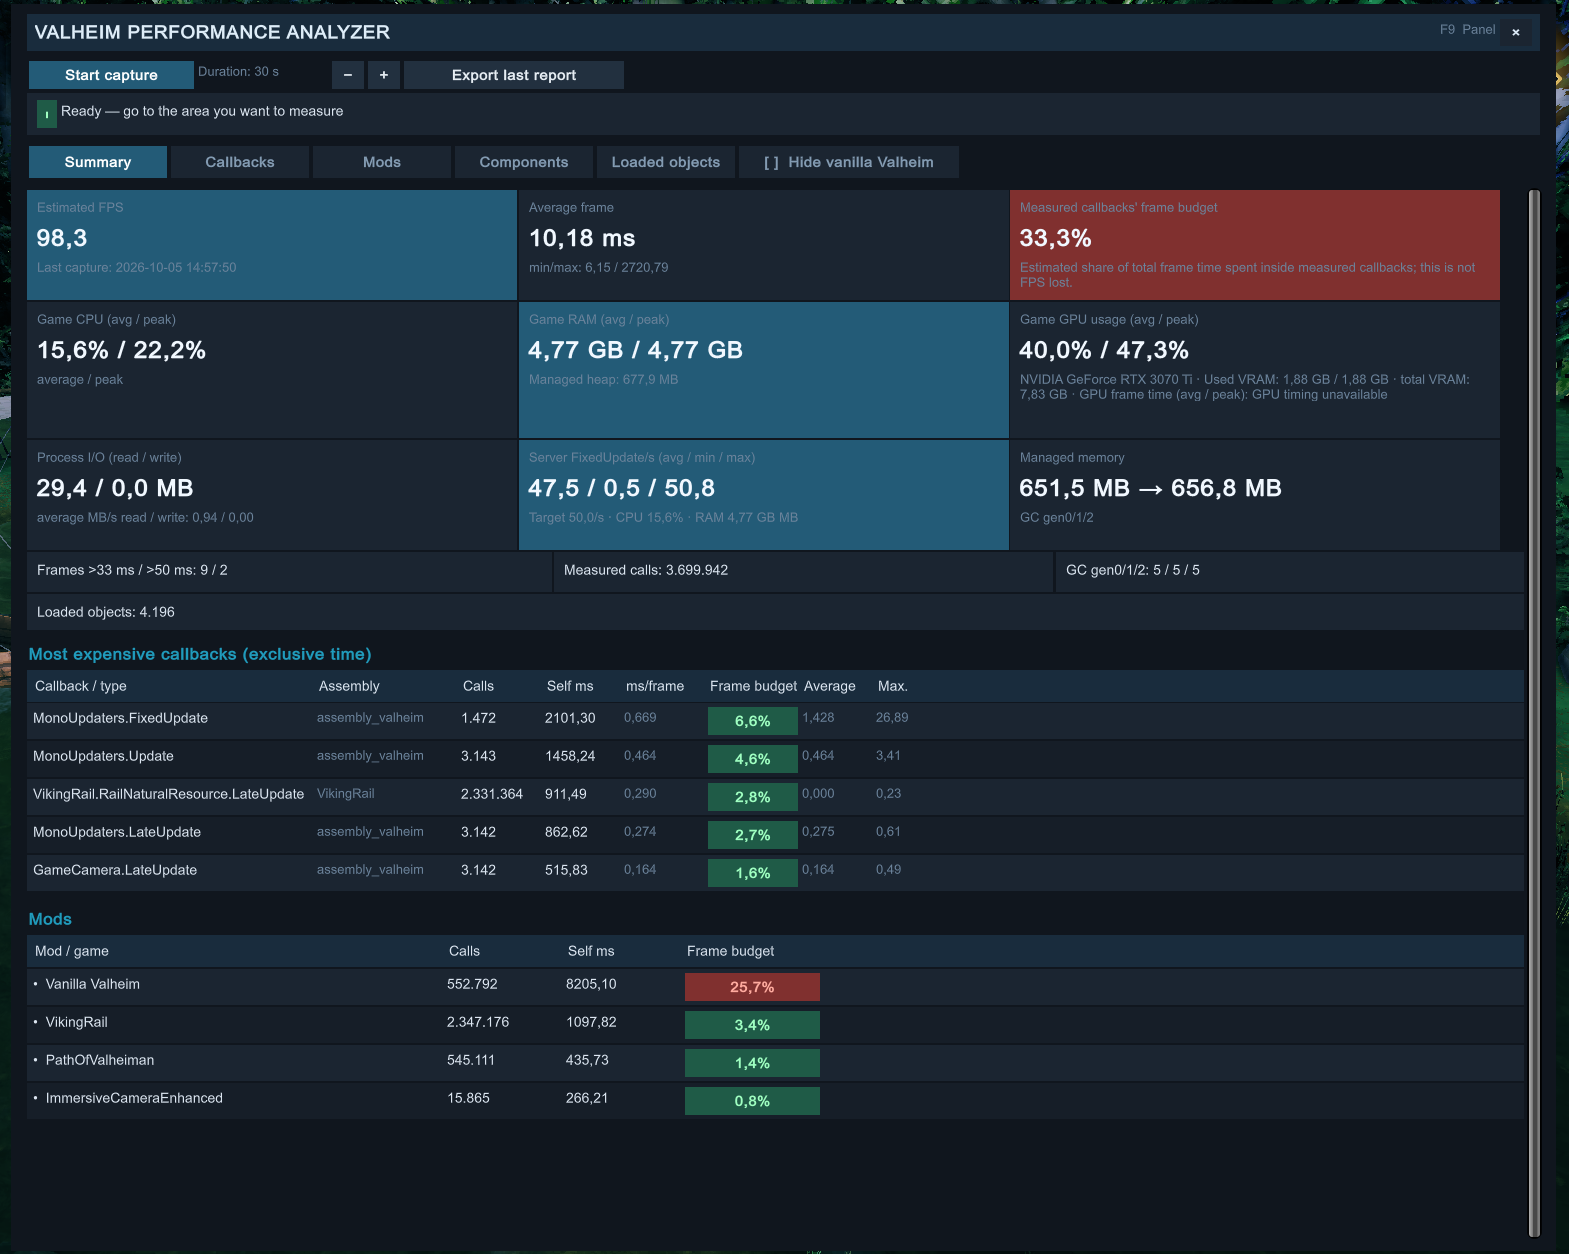
- Records estimated FPS, frame time, P50/P95/P99 frame-time percentiles, slow frames, and the estimated frame-time share of measured callbacks. Retains up to 256 of the slowest frames in a chronological timeline with the largest observed callback, GC counts, and measured Analyzer work in the same interval.
- Resizes HUD tables for slow frames, RPC methods, callbacks, mods, components, instances, and loaded objects with the panel. Column minimums account for localized headers; spare width is distributed across the table, with horizontal scrolling when needed. Cells stay on one line and retain their full text in tooltips.
- Displays the HUD slow-frame timeline in a nine-column table with eight rows per page. Right-aligned numeric columns separate the frame index, elapsed capture time, frame duration, largest observed callback and its inclusive duration, per-generation GC count changes, and measured collector/object-scan/snapshot times. Callback names use tooltips when truncated, and narrow HUD windows can scroll the table horizontally. Page controls provide access to all retained rows in chronological order.
- Reports measured collector, object-scan, and display-snapshot work. During a capture, periodic display snapshots are built only while the HUD is open. Component, loaded-object, and RPC detail is copied only for its corresponding tab. Live Summary percentiles refresh at most every five seconds; final percentiles use exact nearest-rank values over the retained intervals.
- Optionally instruments selected AI, movement, pathfinding, and
MonoUpdaterssimulation routines. Detailed simulation is off by default because additional timing hooks increase profiling cost. - Lists foreign Harmony patch owners as callback metadata. Protected callbacks already patched by Balrond Core Optimizer are excluded to preserve its optimizations;
LineConnect.LateUpdateis also protected when that plugin is loaded. Coverage lists the exclusions and compatibility warnings. - Measures Valheim process CPU use as a percentage of total logical processor capacity and process resident memory (working set), including average and peak values. On Windows, process memory also uses the native process memory API as a fallback.
- Reports managed heap size, managed memory change, and garbage collection counts. Heap measurements are sampled separately from the process working set.
- On Windows, measures the game's process-attributed 3D engine utilization and dedicated graphics memory when the system GPU counters are available. GPU utilization is an approximate per-process sample, not a vendor sensor reading.
- Reports GPU frame time from Unity when supported by the graphics backend and driver, along with the graphics device and detected total VRAM.
- Optionally counts loaded world entities with
ZNetView, including hidden, inactive, and off-camera trees, items, and buildings. Players and creatures are excluded. The Loaded objects tab consolidates entities by object name and owning mod/game, sorted by quantity, with a total entity count. Expand a row to inspect its Unity instance IDs. Enable Capture loaded objects in the HUD to collect complete scans during a capture, with a two-second interval after each completed scan. Classification runs in batches across frames. Unity's initial object discovery remains synchronous and its cost is measured. Opening the HUD alone never scans. - Records process read and write bytes and average I/O rates. Windows counters may include cached operations and do not represent physical disk traffic.
- Measures the observed
FixedUpdaterate and compares it with Unity's target rate. On dedicated servers, this represents the simulation ticks observed by the mod. - Sends lightweight server
FixedUpdate, CPU, and RAM metrics to clients every two seconds. The server sends these metrics only to clients that have this mod installed and whose accounts are recognized as server admins. To view dedicated server metrics, install the mod on both the server and client and connect as an admin. Remote metrics are unavailable without the server mod or admin access. - Adds a Network tab with application socket bytes/messages and rates, anonymous peer summaries, transport send-backlog estimates, supported Steam transport RTT/quality, passive application RTT, jitter, and inclusive RPC costs grouped by method hash. Passive RTT observes the game's native ping/pong without extra traffic and can work with Steam or PlayFab, including unmodded servers. A separate active Analyzer diagnostic adds application round-trip time and server-handler work for authorized admins.
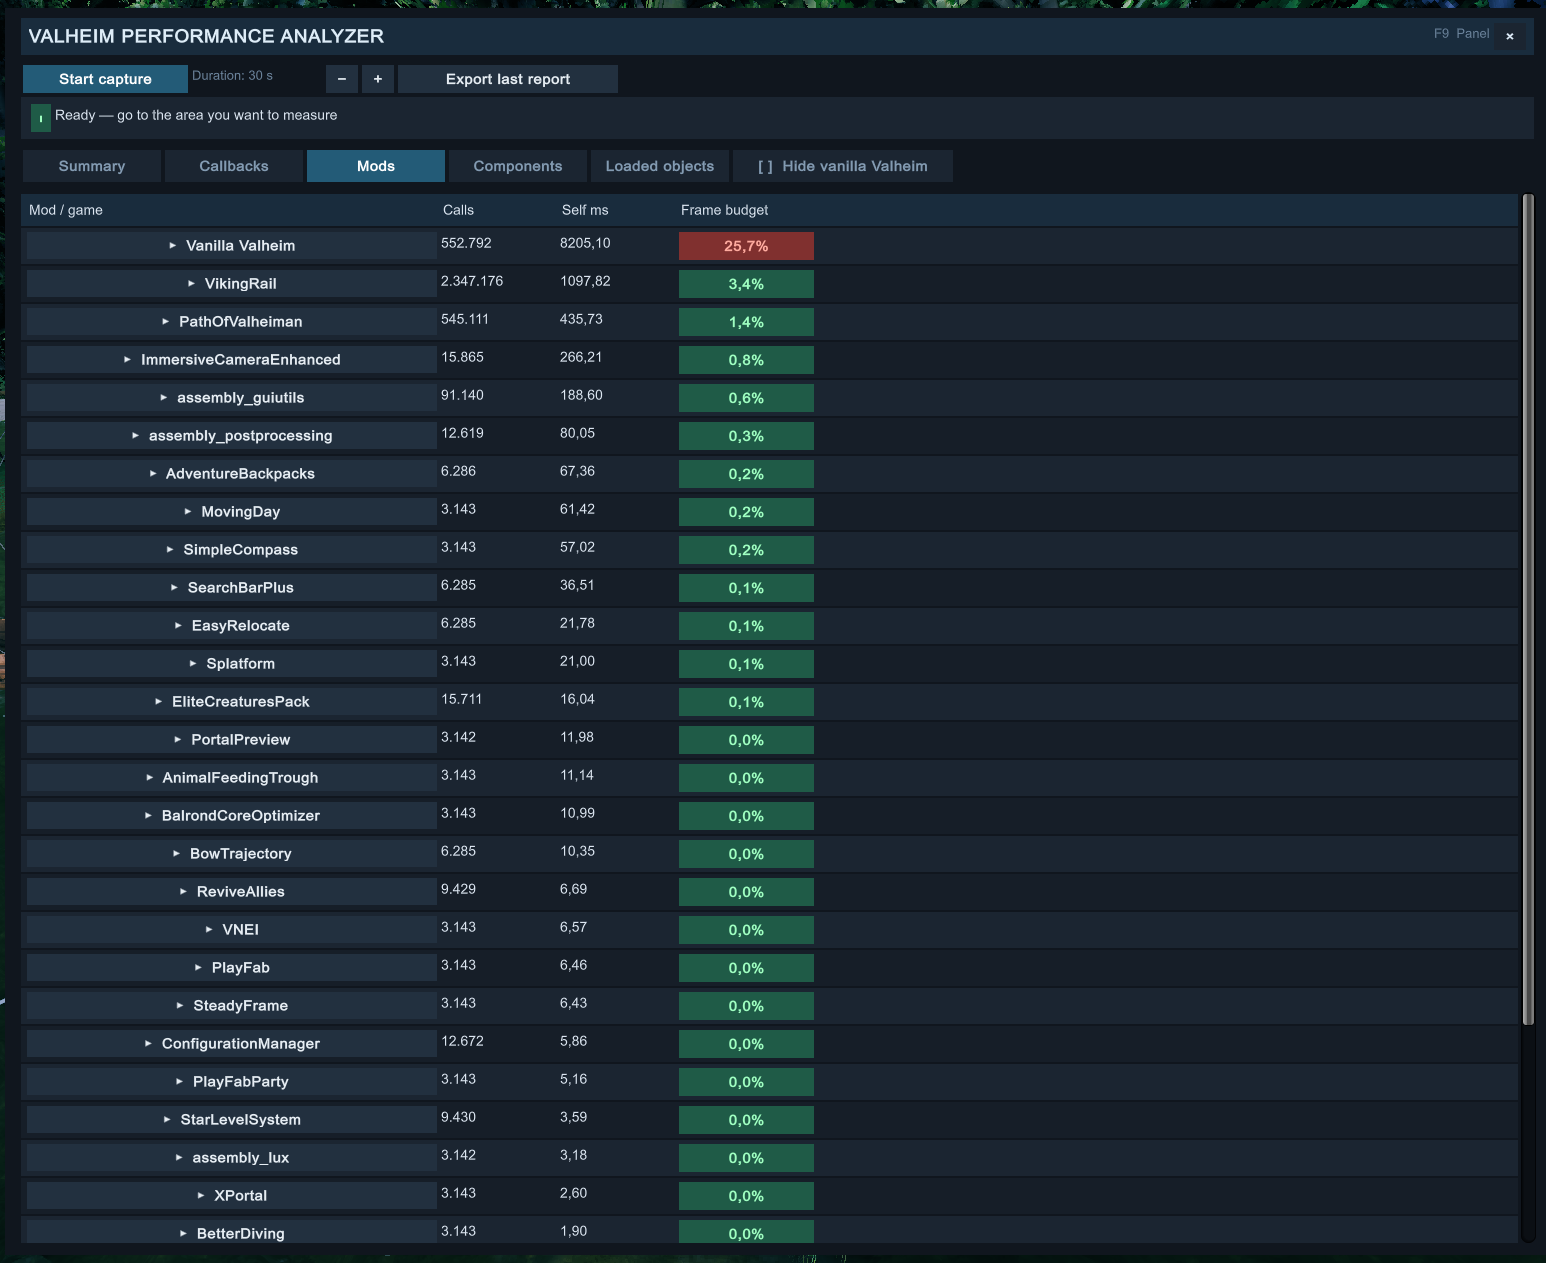
- Groups callbacks by mod assembly and combines
assembly_valheimwithassembly_utilsunder vanilla Valheim. The frame budget percentage estimates each group's share of observed frame time. - Lets you expand each group to inspect its measured callbacks. The Hide vanilla Valheim filter is off by default and also filters the loaded-object list when an object's source can be identified.
- Includes Summary, Callbacks, Mods, Components, Loaded objects, and Network tabs, plus capture and export controls. Summary includes the slow-frame timeline and capture coverage. Object counts are collected only during captures when Capture loaded objects is enabled; this option is off by default.
- Lets you resize the HUD by dragging its borders. Press F9 to show or hide the panel, or use the × button to close it. The cursor is released while the HUD is open. Game controls and UGUI interfaces are blocked so the character cannot attack, move the camera, or click items behind the panel.
- Lets you set the capture duration from the HUD, from 5 to 300 seconds in 5-second increments.
- During a capture, displays elapsed and total time in the HUD and as a temporary character status effect with an icon and countdown. The effect does not change character attributes. Its countdown uses the same monotonic clock as the capture and panel timer, so it catches up on the next update after a stall or pause instead of losing elapsed seconds.
- Exports a standalone
index.htmltoBepInEx/config/ValheimPerformanceAnalyzer/Reports/only when Export last report is clicked. A completed or manually stopped capture remains in the HUD and does not automatically create a report. Numbers follow the language selected in Valheim, and sortable columns use their underlying values. The first header click sorts ascending; the next reverses the order. Tabs separate the summary, slow frames, callback/mod costs, components, instances, loaded objects, network, and coverage. Tables support column reordering and search. The HTML always includes the full capture, opens with vanilla visible, and has its own Hide Valheim vanilla checkbox; changing it updates the displayed callback totals and measured shares without changing FPS or hardware metrics. The HUD filter does not remove data from the export. - Posts a concise report-directory path as a local-only chat line after the export button is clicked. This message is not sent to other players.
- Shows the full text in a tooltip while the cursor is over HUD labels that have been truncated to fit.
- Preserves translations for Valheim's available languages; new diagnostic labels use English fallback and Portuguese translations.
Feature demonstrations
Summary
Mod costs
Callbacks
How to use
- Install BepInEx and place
ValheimPerformanceAnalyzer.dllinBepInEx/plugins/ValheimPerformanceAnalyzer/. - Start Valheim and enter the world you want to profile.
- Press F9 to open the HUD. Choose whether to include Capture loaded objects and Detailed simulation, set the duration with − / +, then click Start capture and reproduce the scenario once preparation finishes. Both optional detail modes are disabled by default. Close the panel while reproducing a slowdown to avoid its periodic display-snapshot work. The capture ends automatically or can be stopped with Stop capture; either way, the results remain in the HUD.
- In Mods, click a mod or vanilla Valheim to expand its callbacks. The mod list and expanded callback details are paginated to keep the HUD responsive. Use Components to inspect tracked types and instances. Loaded objects shows up to 50 object types per page, consolidated by object name and owning mod/game, ordered by quantity. Expand a row to inspect its Unity IDs. Opening this tab does not scan the scene.
- Review the frame percentiles, slow-frame timeline, measured Analyzer work, and coverage in Summary. The HUD timeline shows eight rows per page; use its page controls to inspect the retained frames in chronological order. Use Network for socket traffic, transport statistics, remote diagnostics, and RPC costs.
- Click Export last report when you want to create the HTML report. The local chat shows the report directory; the message is not broadcast to other players.
You can also start and stop captures through the console:
perfprof start
perfprof stop
perfprof status
The console commands start, stop, or show the status of a capture. Export the report with the HUD button.
Client and dedicated server
Install the mod on the client to measure the local process, including CPU, resident RAM, GPU, I/O, and callbacks. A server installation is not required to investigate local FPS or callbacks.
To view remote FixedUpdate, CPU, and RAM metrics in the client's Summary tab, install the mod on both client and dedicated server, then connect with an account the server recognizes as an admin. The server does not display a HUD or automatically export HTML reports. It can start a capture with Capture/AutoStartCapture or the console commands. Periodic telemetry is sent only to modded clients that pass the admin check; vanilla clients and non-admin players do not receive these packets.
Remote server metrics and the active Analyzer diagnostic require the protocol introduced in 1.1.0 on both client and server; 1.1.1 through 1.1.3 keep that protocol unchanged and work with a 1.1.0 server. Earlier releases do not negotiate this protocol. Server installation remains optional for local profiling and passive application RTT. A client capturing on a vanilla or unsupported server sends one capability request per connection and does not keep retrying an unanswered request. Active diagnostic probes run only after a compatible server confirms admin access, normally every five seconds during a capture. Authorized connections renew their telemetry registration at a low rate. Passive RTT observes existing native ping/pong messages and does not require this negotiation.
Interpreting the metrics
- CPU: Valheim process use relative to the total capacity of all logical processors. 100% represents the full aggregate capacity; one fully occupied core on an 8-logical-processor system is about 12.5%.
- RAM: Process working set (resident memory), with the Windows process memory API as a fallback. The two displayed RAM values are average and peak process use during the capture; they are not the computer's installed RAM capacity. Managed heap and GC are measured separately.
- GPU: Process-attributed 3D engine utilization and dedicated memory from Windows counters when available. Paired utilization and used-VRAM values are average and peak during the capture. For example, used VRAM of
2.11 / 2.14 GBmeans average usage of 2.11 GB and peak usage of 2.14 GB. Total VRAM is shown separately and represents detected device capacity. Frame time is a separate Unity measurement and depends on the driver and graphics backend. - Loaded objects: World entities with
ZNetViewin loaded scenes, including inactive, hidden, and off-camera objects. Entities whoseCharactercomponent identifies them as players or creatures are excluded. Local scene objects withoutZNetVieware not counted. When Capture loaded objects is enabled, classification runs in batches during a capture, with a two-second interval after each completed scan; the option is off by default and opening the HUD never starts a scan. The HUD and report group results by normalized object name and owning assembly; each row's quantity is the number of matching loaded entities. - I/O: Read and write byte counters attributed to the process. Operating system caching can make measured traffic differ from physical disk reads.
- Ticks: Observed
FixedUpdatecalls per second and the target derived fromTime.fixedDeltaTime. This measures Unity simulation frequency, not ping or network rate.
Frames, profiling cost, and coverage
P50/P95/P99 show the time within which 50%, 95%, and 99% of measured frame intervals finish. Live percentiles in Summary refresh at most every five seconds. The completed capture computes exact nearest-rank percentiles over all retained intervals. The local capture clock begins after preparation so installing patches does not become the first recorded gameplay frame. Preparation includes patch installation; the separately displayed patching time is part of preparation, so those values should not be added together.
The timeline retains up to 256 of the slowest intervals of at least 33.333 ms, then displays them in chronological order. In the HUD, an aligned table shows eight rows per page with page controls for the remaining retained intervals. Columns show the frame index, elapsed time since capture started, frame duration, largest measured callback invocation and its inclusive duration, GC collection-count changes for generations 0/1/2, and measured collector/object-scan/snapshot work in that interval. GC values count collections; they do not measure GC pause duration. These observations help compare events in the same interval; they do not establish which callback or GC caused a stall. The callback value is inclusive and can overlap nested work. Percentiles retain up to the first 1,000,000 intervals; a coverage warning identifies that limit if it is reached.
The Analyzer records its measured collector, object-scan, and display-snapshot work separately. These measurements do not account for every effect of timing hooks on execution. Compare repeated captures with an uncaptured baseline and keep the same scene and options when comparing results. Object classification is spread across frames, but Unity's initial object enumeration remains one synchronous operation and may still cause a measured spike. Periodic display snapshots run only while the HUD is open during a capture. Component, loaded-object, and RPC details are copied only for their respective tabs, and frame details/percentiles are updated for Summary. Recording continues with the panel closed, and stopping creates the complete final snapshot.
The default callback scan does not cover every game or mod function. Detailed simulation adds a selective list of AI, character movement, pathfinding, and concrete update routines called by MonoUpdaters; it increases instrumentation cost and remains off by default. Method and tracked-component limits also bound coverage. The owning assembly groups measured callbacks; a Harmony owner identifies a patch, not a separately measured cost for that mod. A patched callback can include original game work and multiple patches.
To preserve Balrond Core Optimizer's foreign-patch safety checks, the Analyzer skips callbacks already patched by its Harmony owner and protects LineConnect.LateUpdate whenever the Balrond plugin is loaded. The capture's coverage lists excluded callback names and warnings, including recognized compatibility logs emitted after recording starts. Excluded callback time is unavailable. This does not change Balrond's configuration, patches, or safety policy.
Network measurements and limits
- Traffic: Bytes and message counts at
ISocket.Send/Recv, with capture averages and sampled current rates. These are application packages offered for sending or delivered to the application. They include Analyzer diagnostic traffic and exclude transport framing, encryption, compression effects, and retransmissions; they are not on-wire bandwidth or a delivery guarantee. - Transport RTT and quality: The inspected Steam transport exposes actual RTT and connection-quality values. PlayFab/crossplay does not expose equivalent transport values through these hooks, so these fields stay unavailable rather than showing synthetic zero ping. Passive application RTT is a separate measurement and can still be available on PlayFab. On a server, the transport summary averages currently measurable peers; changing peer membership can affect the result. Connection-quality values are not packet-loss measurements.
- Passive application RTT: Observes the game's existing native ping/pong messages without sending additional traffic. It can measure round trips on Steam or PlayFab, including connections to a server without this mod, when messages can be correlated. It includes server queueing and scheduling as well as transport time, so it is separate from Steam transport RTT. The native protocol has no nonce; ambiguous samples are discarded and shown as unavailable when a valid measurement cannot be made.
- Jitter: The mean absolute difference between successive RTT samples, not standard deviation or packet loss. It requires at least two valid samples. Transport, passive application RTT, and the active Analyzer diagnostic have separate summaries.
- Queues: Current and maximum observed transport-reported send backlog. Steam includes pending/unacknowledged reliable data, pending unreliable data, and the local queue; the game's PlayFab API estimates backlog as 25% of bytes in flight. These values have transport-specific meanings and are not directly equivalent. A zero does not prove that every internal queue is empty; these hooks do not measure receive queues or all transport-internal buffers.
- RPC work: Send, receive-handler, and routed-handler calls are grouped by anonymous peer, layer/direction, and stable method hash, with bytes, calls, errors, and inclusive elapsed time. Nested RPC layers overlap, so their timings and byte totals must not be added as independent work or bandwidth. Method-name strings are not retained; a hash is an identifier and collisions are possible.
- Bounded anonymous summaries: Up to 128 historical peer identities plus one overflow peer, and 512 RPC groups plus up to three layer/direction overflow groups, are retained per capture. Peer labels such as
peer-1apply only to that capture. Payloads, endpoints, player names, platform IDs, and RPC method-name strings are not retained in the network report. - Active Analyzer diagnostic RTT: Available only with a compatible modded server and confirmed admin access. This application round trip includes scheduling, transport, and handler work; it is separate from Steam's transport RTT and the passive native ping/pong measurement. The server's reported processing time covers handler entry through response construction, excluding queueing before handler entry and the response send. It cannot isolate all server scheduling delay or one-way latency. Diagnostic timeouts count unanswered probes, not lost network packets.
Configuration
Settings are stored in BepInEx/config/com.kimbauer.valheim.performanceanalyzer.cfg:
Capture/DurationSeconds: default capture duration, from 5 to 300 seconds.Capture/IncludeLoadedObjects: collects and groups loaded world objects during a capture; off by default. The HUD checkbox controls this option.Capture/DetailedSimulation: adds selected AI, movement, pathfinding, and dispatched simulation routines; off by default. The HUD toggle controls this option and additional hooks increase capture overhead.Capture/AutoStartCapture: starts a capture when a world session begins; useful on a dedicated server.Capture/MaxTrackedComponents: limit on individual instrumented component instances retained per capture; it does not limit the grouped loaded-object list.Capture/MaxPatchedMethods: limit on instrumented callbacks.Interface/EnableHotkeys: enables F9 to show or hide the HUD.Interface/OverlayHotkey: key used to show or hide the HUD.Interface/HideValheimCallbacks: hides vanilla Valheim in the in-game HUD only; off by default. The HTML report has a separate filter and always exports all data.
The HUD starts closed. Press F9 to open it.