

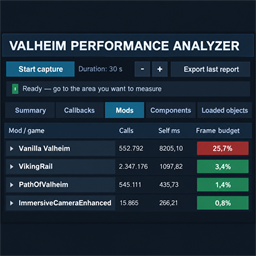
ValheimPerformanceAnalyzer
Analyzes Valheim and mod callbacks, loaded world objects, process CPU and RAM, GPU usage and VRAM, I/O, and admin-only server telemetry. Includes an interactive HUD and sortable HTML report.Valheim Performance Analyzer
A BepInEx tool for finding which Valheim and mod callbacks consume the most time during gameplay. Version 1.0 combines callback profiling, process metrics, optional server telemetry, an interactive HUD, and a local HTML report.
Features
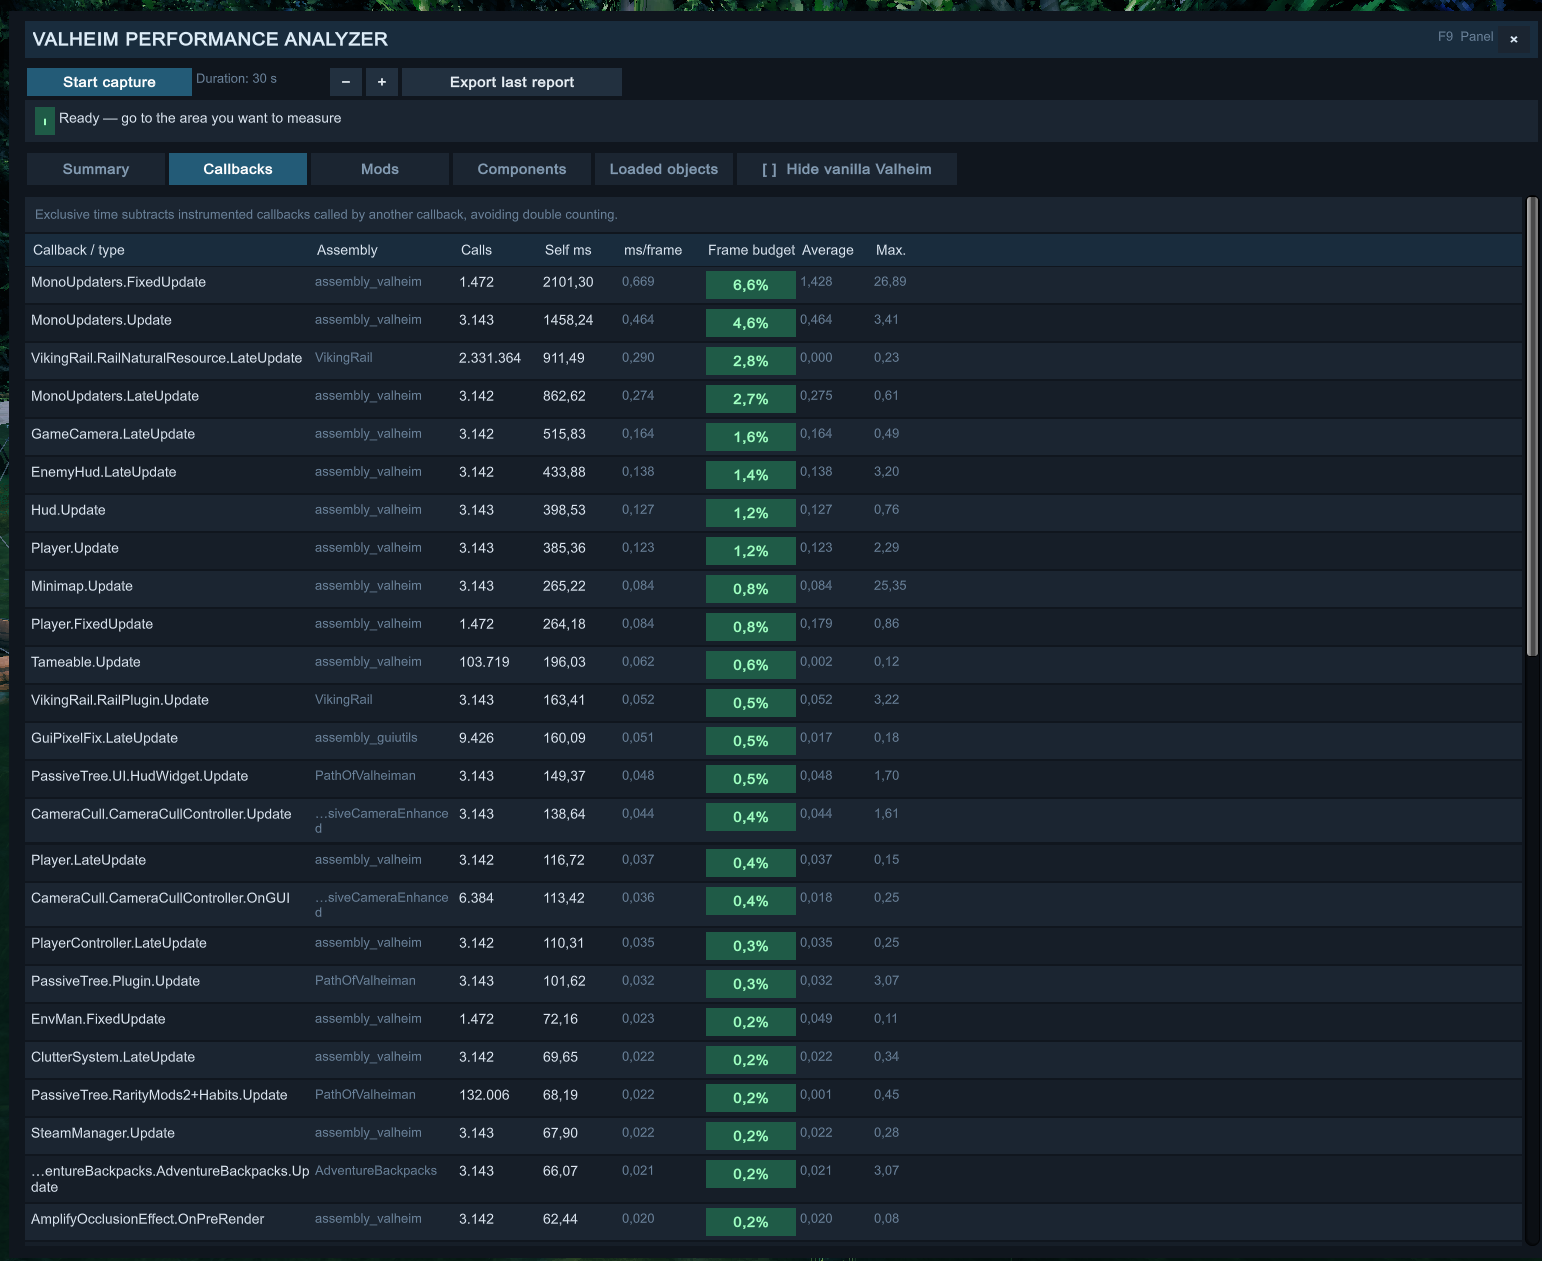
- Measures exclusive time, call count, average and maximum duration, and exceptions for instrumented recurring callbacks.
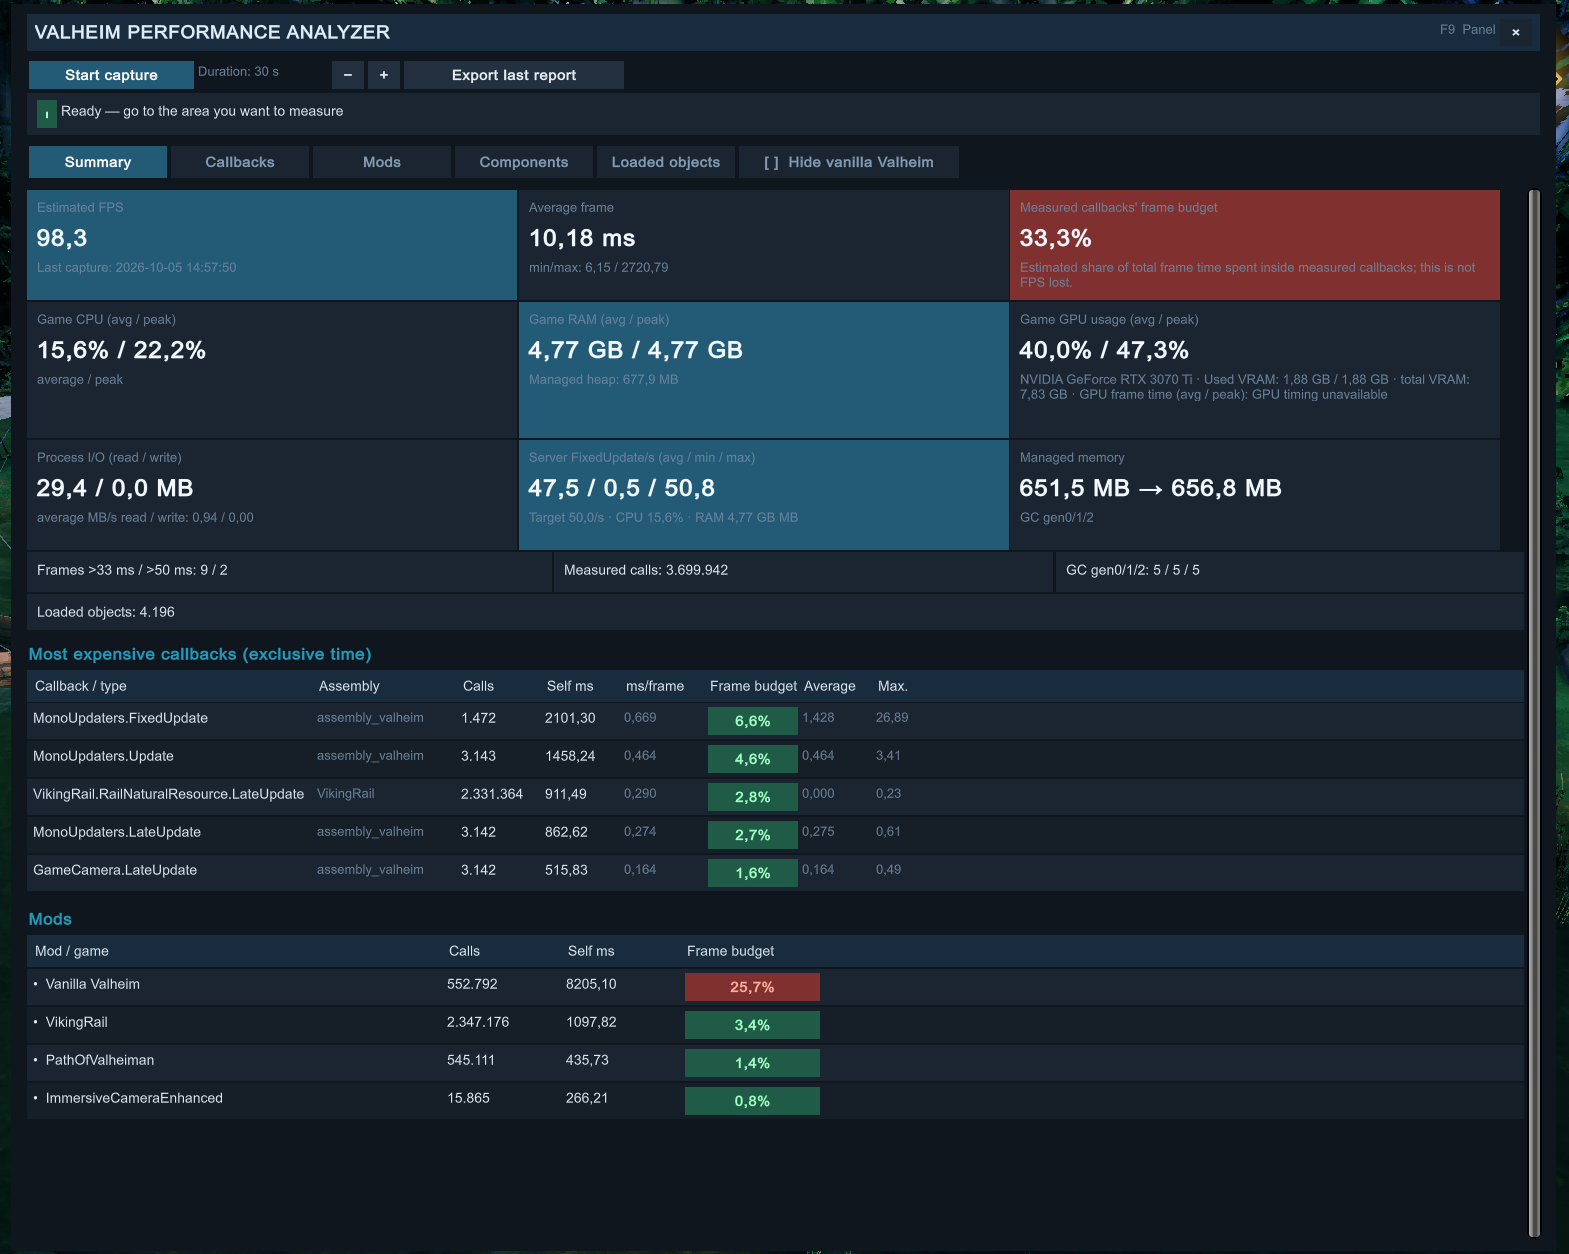
- Records estimated FPS, frame time, slow frames, and the estimated frame-time share of measured callbacks.
- Measures Valheim process CPU use as a percentage of total logical processor capacity and process resident memory (working set), including average and peak values. On Windows, process memory also uses the native process memory API as a fallback.
- Reports managed heap size, managed memory change, and garbage collection counts. Heap measurements are sampled separately from the process working set.
- On Windows, measures the game's process-attributed 3D engine utilization and dedicated graphics memory when the system GPU counters are available. GPU utilization is an approximate per-process sample, not a vendor sensor reading.
- Reports GPU frame time from Unity when supported by the graphics backend and driver, along with the graphics device and detected total VRAM.
- Counts loaded world entities with
ZNetView, including hidden, inactive, and off-camera trees, items, and buildings. Players and creatures are excluded. The Loaded objects tab shows the current total and each instance's Unity ID. The list is sampled every two seconds while the HUD is open or a capture is running, and is included in the report. - Records process read and write bytes and average I/O rates. Windows counters may include cached operations and do not represent physical disk traffic.
- Measures the observed
FixedUpdaterate and compares it with Unity's target rate. On dedicated servers, this represents the simulation ticks observed by the mod. - Sends lightweight server
FixedUpdate, CPU, and RAM metrics to clients every two seconds. The server sends these metrics only to clients that have this mod installed and whose accounts are recognized as server admins. To view dedicated server metrics, install the mod on both the server and client and connect as an admin. Remote metrics are unavailable without the server mod or admin access. - Groups callbacks by mod assembly and combines
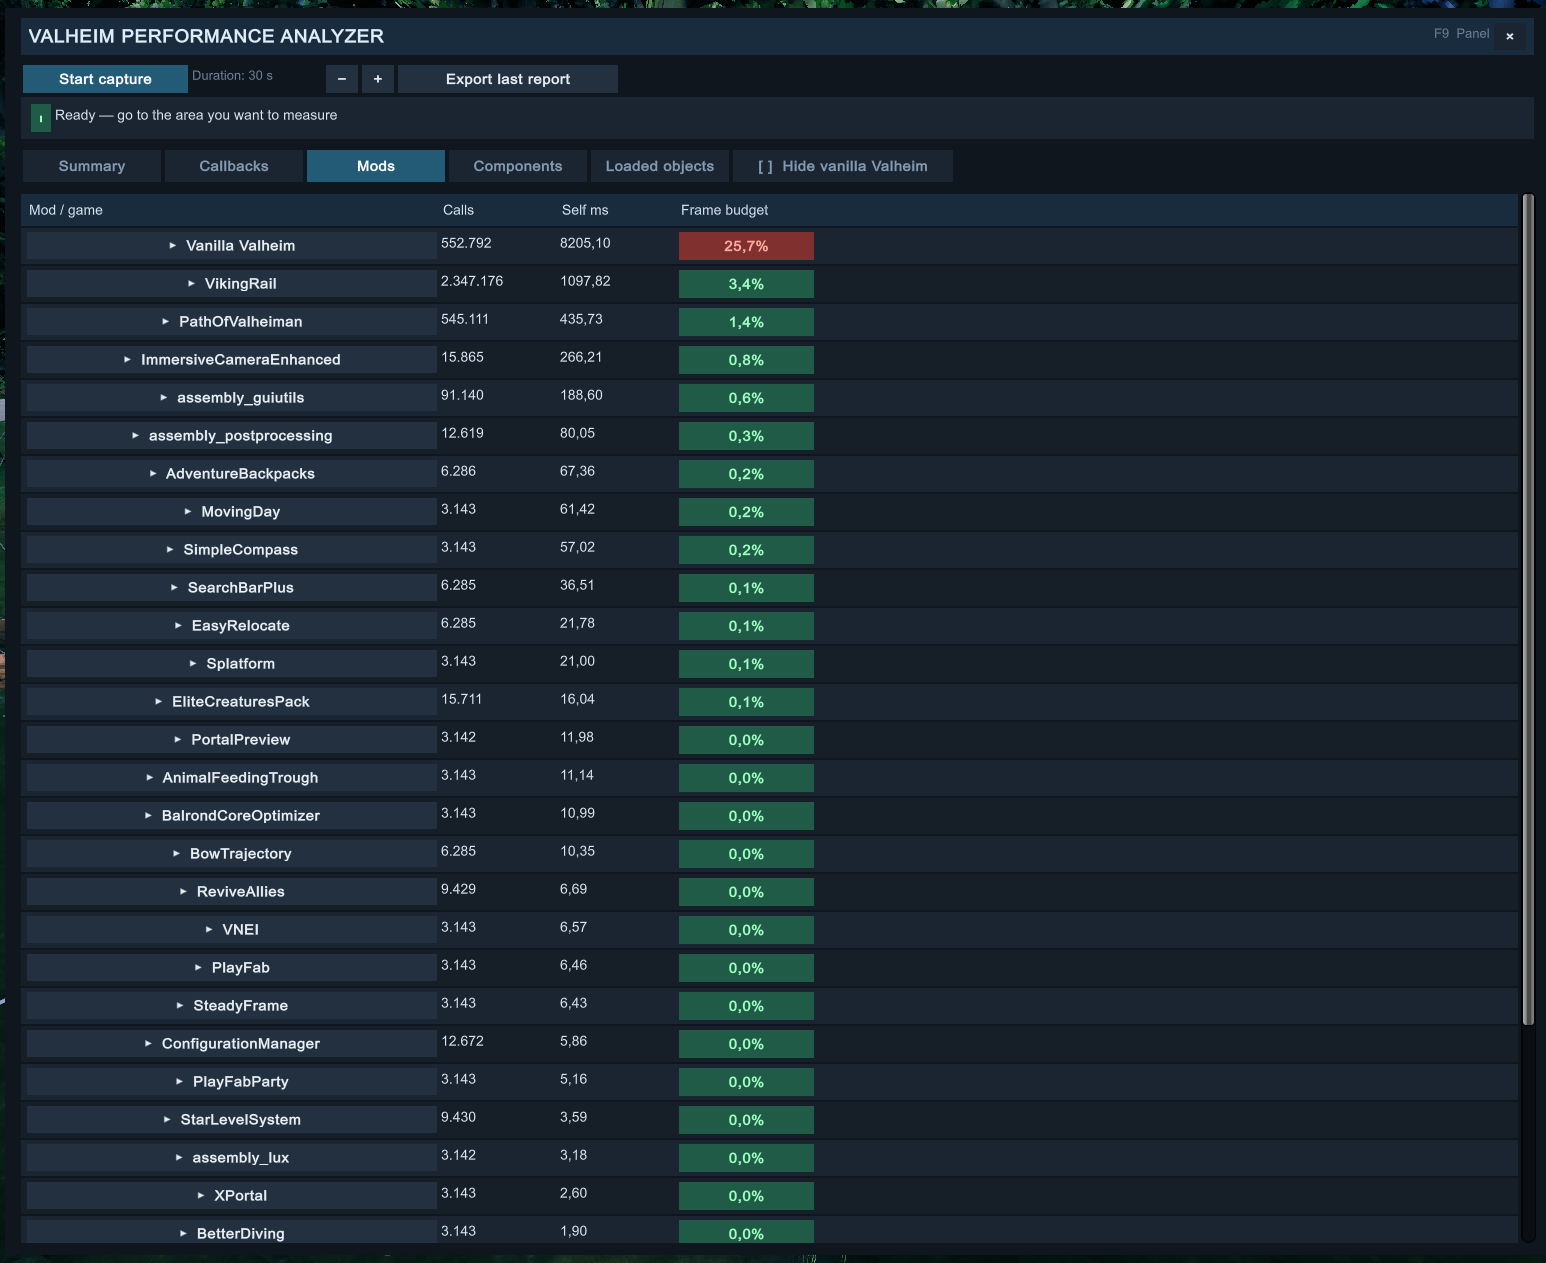
assembly_valheimwithassembly_utilsunder vanilla Valheim. The frame budget percentage estimates each group's share of observed frame time. - Lets you expand each group to inspect its measured callbacks. The Hide vanilla Valheim filter is off by default and also filters the loaded-object list when an object's source can be identified.
- Includes Summary, Callbacks, Mods, Components, and Loaded objects tabs, plus capture and export controls. Object counts are available without starting a capture.
- Lets you resize the HUD by dragging its borders. Press F9 to show or hide the panel, or use the × button to close it. The cursor is released while the HUD is open. Game controls and UGUI interfaces are blocked so the character cannot attack, move the camera, or click items behind the panel.
- Lets you set the capture duration from the HUD, from 5 to 300 seconds in 5-second increments.
- During a capture, displays elapsed and total time in the HUD and as a temporary character status effect with an icon and countdown. The effect does not change character attributes.
- Exports a standalone
index.htmltoBepInEx/config/ValheimPerformanceAnalyzer/Reports/. Numbers follow the language selected in Valheim, and numeric columns sort by their underlying values rather than formatted text. Tables support column reordering and search. Expandable groups show their callbacks; the report also includes object IDs and the collected CPU, GPU, memory, I/O, and server metrics. - Posts the report path as a local chat message after export.
- Shows the full text in a tooltip while the cursor is over HUD labels that have been truncated to fit.
Feature demonstrations
Summary
Mod costs
Callbacks
How to use
- Install BepInEx and place
ValheimPerformanceAnalyzer.dllinBepInEx/plugins/ValheimPerformanceAnalyzer/. - Start Valheim and enter the world you want to profile.
- Press F9 to open the HUD. Click Start capture, adjust the duration with − / +, and reproduce the scenario you want to measure. The HUD shows elapsed time and progress. The capture ends automatically or can be stopped with Stop and save.
- In Mods, click a mod or vanilla Valheim to expand its callbacks. Use Components to inspect tracked types and instances. Loaded objects shows the current total and the ID of each loaded entity.
- Click Export last report. The path to
index.htmlappears in local chat.
You can also start and stop captures through the console:
perfprof start
perfprof stop
perfprof status
perfprof report
Client and dedicated server
Install the mod on the client to measure the local process, including CPU, resident RAM, GPU, I/O, and callbacks. A server installation is not required to investigate local FPS or callbacks.
To view remote FixedUpdate, CPU, and RAM metrics in the client's Summary tab, install the mod on both client and dedicated server, then connect with an account the server recognizes as an admin. The server does not display a HUD. It can save its own report using Capture/AutoStartCapture or the console commands. Periodic telemetry is sent only to modded clients that pass the admin check; vanilla clients and non-admin players do not receive these packets.
Interpreting the metrics
- CPU: Valheim process use relative to the total capacity of all logical processors. 100% represents the full aggregate capacity; one fully occupied core on an 8-logical-processor system is about 12.5%.
- RAM: Process working set (resident memory), with the Windows process memory API as a fallback. Managed heap and GC are measured separately.
- GPU: Process-attributed 3D engine utilization and dedicated memory from Windows counters when available. Frame time is a separate Unity measurement and depends on the driver and graphics backend. Total VRAM is the detected device capacity.
- Loaded objects: World entities with
ZNetViewin loaded scenes, including inactive, hidden, and off-camera objects. Entities whoseCharactercomponent identifies them as players or creatures are excluded. Local scene objects withoutZNetVieware not counted. The list is sampled every two seconds. - I/O: Read and write byte counters attributed to the process. Operating system caching can make measured traffic differ from physical disk reads.
- Ticks: Observed
FixedUpdatecalls per second and the target derived fromTime.fixedDeltaTime. This measures Unity simulation frequency, not ping or network rate.
Configuration
Settings are stored in BepInEx/config/com.kimbauer.valheim.performanceanalyzer.cfg:
Capture/DurationSeconds: default capture duration, from 5 to 300 seconds.Capture/AutoStartCapture: starts a capture when a world session begins; useful on a dedicated server.Capture/MaxTrackedComponents: limit on individual instrumented component instances retained per capture; it does not limit the grouped loaded-object list.Capture/MaxPatchedMethods: limit on instrumented callbacks.Interface/EnableHotkeys: enables F9 to show or hide the HUD.Interface/OverlayHotkey: key used to show or hide the HUD.Interface/HideValheimCallbacks: hides vanilla Valheim in views and reports; off by default.
The HUD starts closed. Press F9 to open it.